COVID-19 Utilization Analysis report
Overview
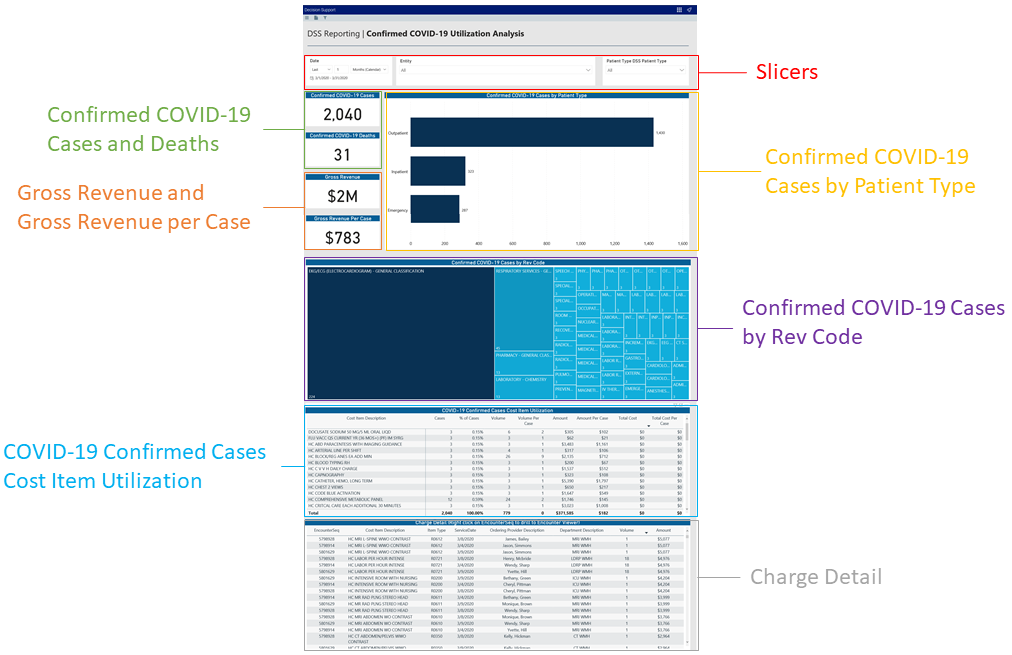
This page provides the data related to the utilization activity and cost of critical resources needed to care for COVID-19 patient populations.
To return to the dashboard home page, click the COVID-19 CDC Coding tab at the bottom of the page.
Click image to view full size
The following sections describe the different areas of this page.
Slicers
This section allows you to filter data by date (days, weeks, months, years), entity, and patient type. From the slicer drop-downs, you can select a combination of the available options to select the parameters to include in the views. The data and visuals in this report will dynamically update with the selection of the different parameters.

Click image to view full size
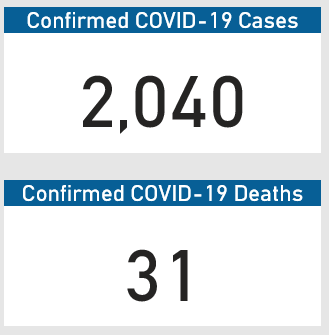
Confirmed COVID-19 Cases and Deaths
This section displays the number of COVID-19 cases and deaths across the population based on the parameters set in the Slicer section.
Click image to view full size
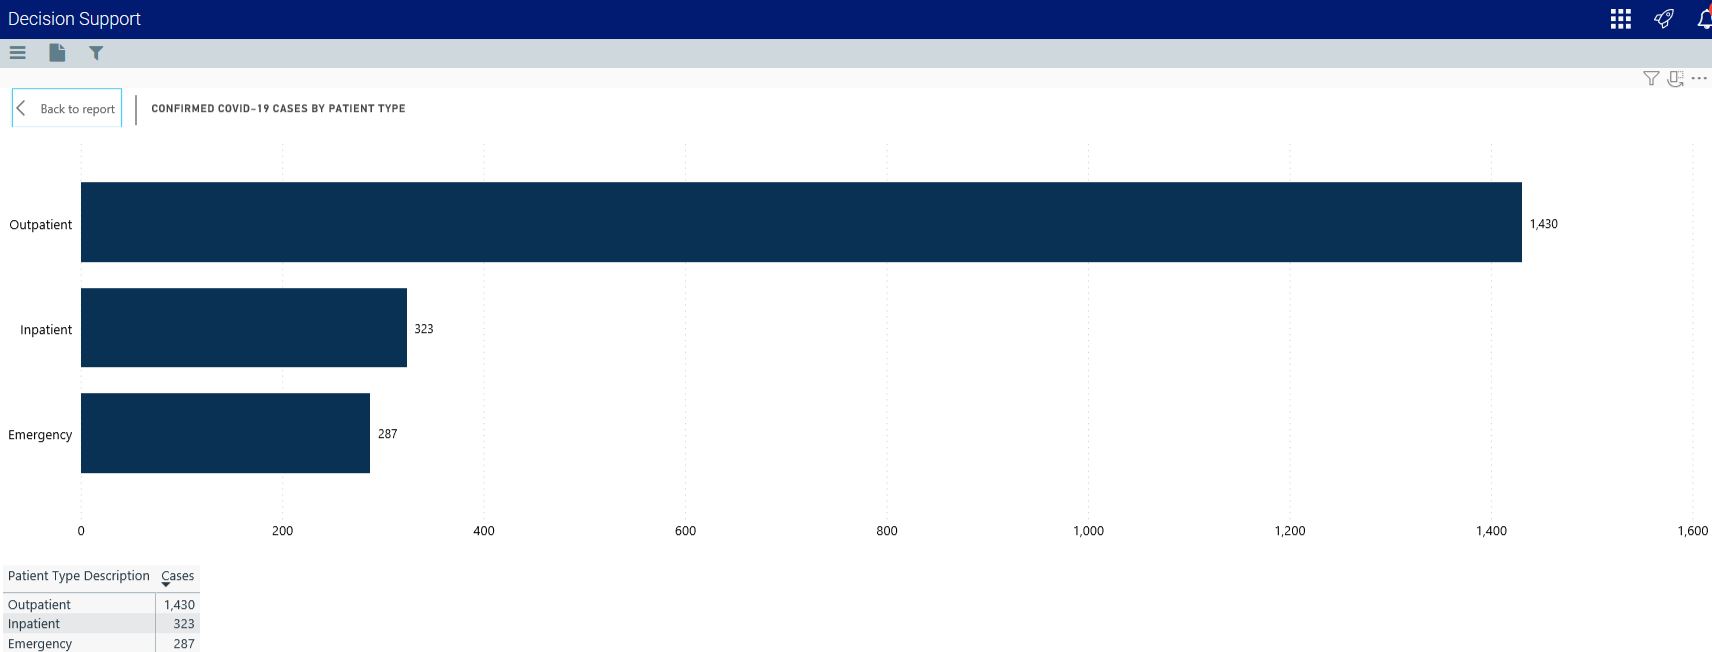
Confirmed COVID-19 Cases by Patient Type
This bar chart displays the number of cases by patient types. Hover your cursor over each bar to view a tool tip with details regarding the patient type description and the number of cases for that type.

Click image to view full size
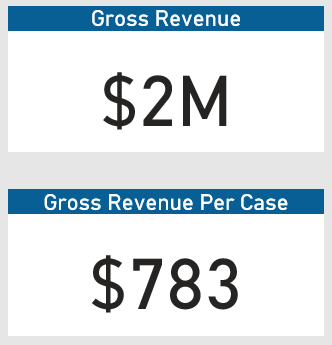
Gross Revenue and Gross Revenue per Case
This section displays the gross revenue and gross revenue per case across the population based on the parameters set in the Slicer section.
Click image to view full size
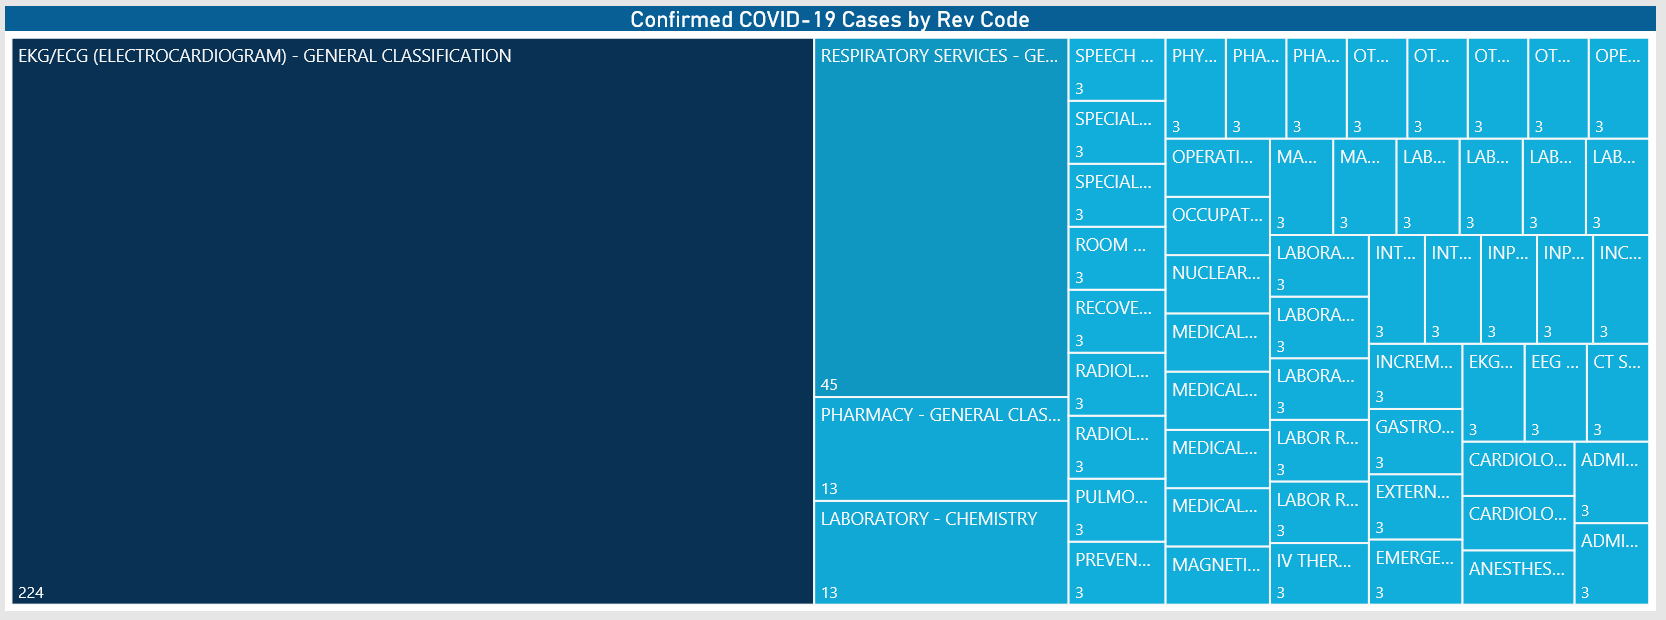
Confirmed COVID-19 Cases by Rev Code
This graph provides a visual representation of the number of COVID-19 cases by revenue code. Hover your cursor over each square to view a tool tip with the revenue code description and number of cases for that revenue code.
Click image to view full size
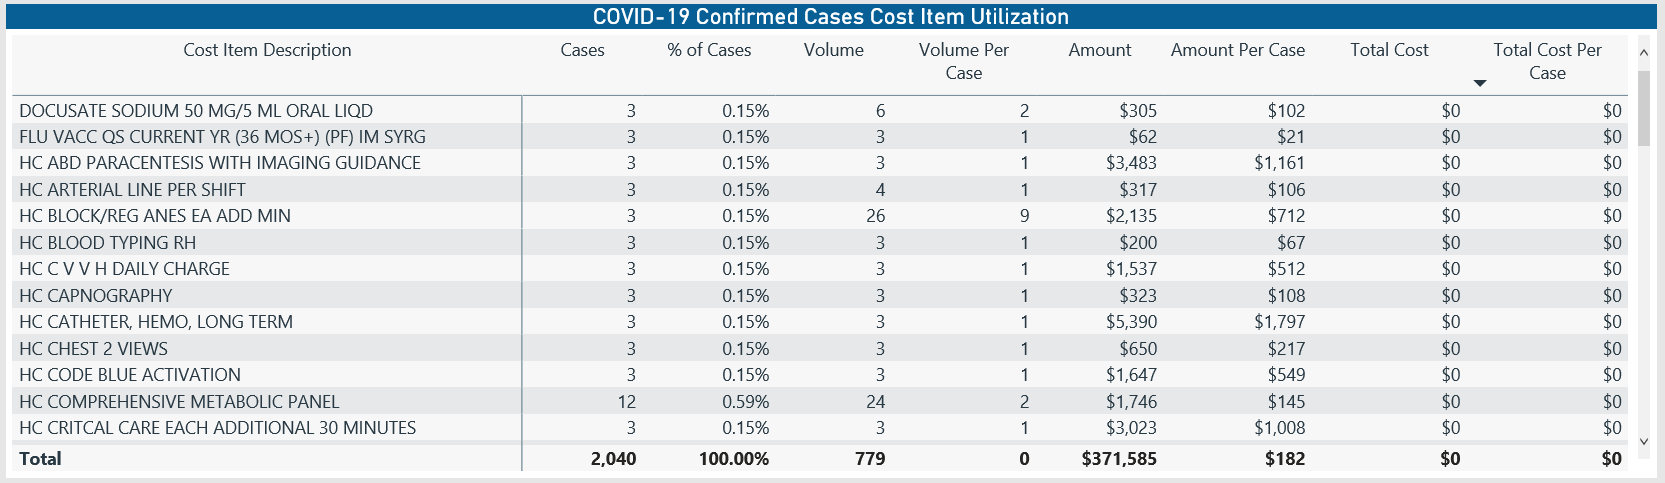
COVID-19 Confirmed Cases Cost Item Utilization
This table displays the charge details data for each encounter, including the following:
- Encounter Sequence
- Cost Item Description
- Item Type
- Service Date
- Ordering Provider Description
- Department Description
- Volume
- Amount
From this table, you can do the following:
- Change the report visuals for a specific encounter by clicking a row. The system greys out the details for the other descriptions across the page except for data specific to the description you selected.
- Sort the table by columns in ascending or descending order by clicking the column header.
Click image to view full size
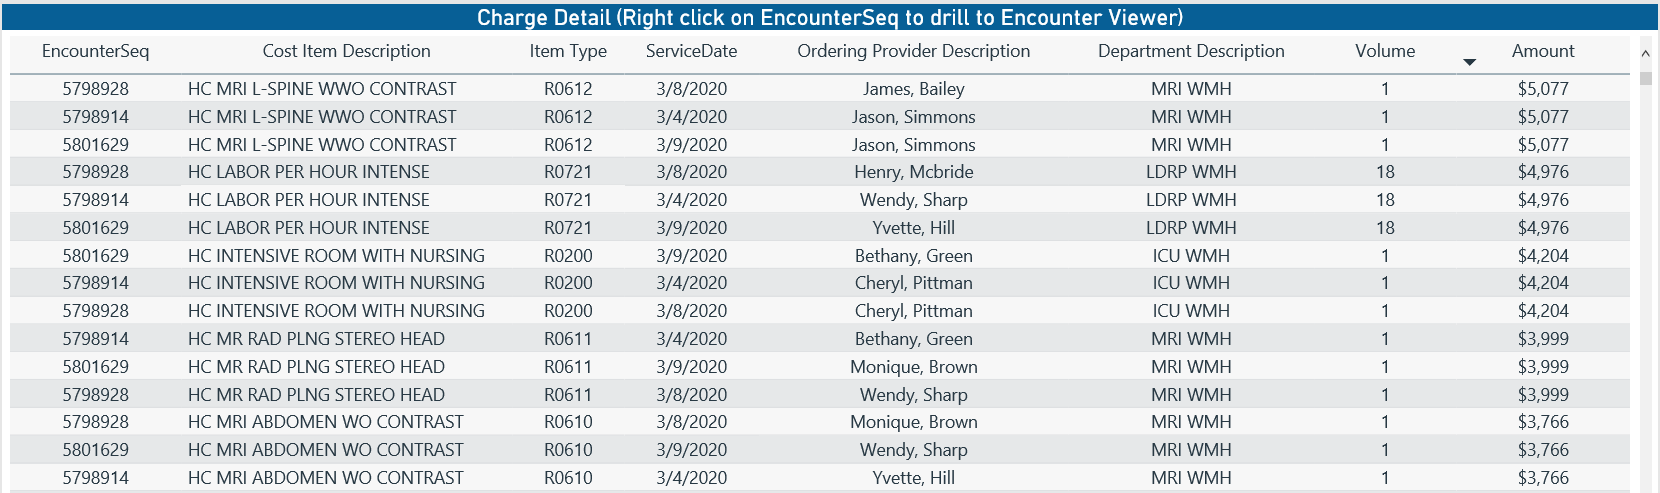
Charge Detail
This table displays the charge item information for encounters, including the following:
- Encounter Sequence
- Cost Item Description
- Item Type
- Service Date
- Ordering Provider Description
- Department Description
- Volume
- Amount
From this table, you can do the following:
- Change the report visuals for a specific encounter by clicking a row. The system greys out the details for the other descriptions across the page except for data specific to the description you selected.
- Sort the table by columns in ascending or descending order by clicking the column header.
- Drill through the data by right-clicking the row, and then selecting Drill Through.
Click image to view full size
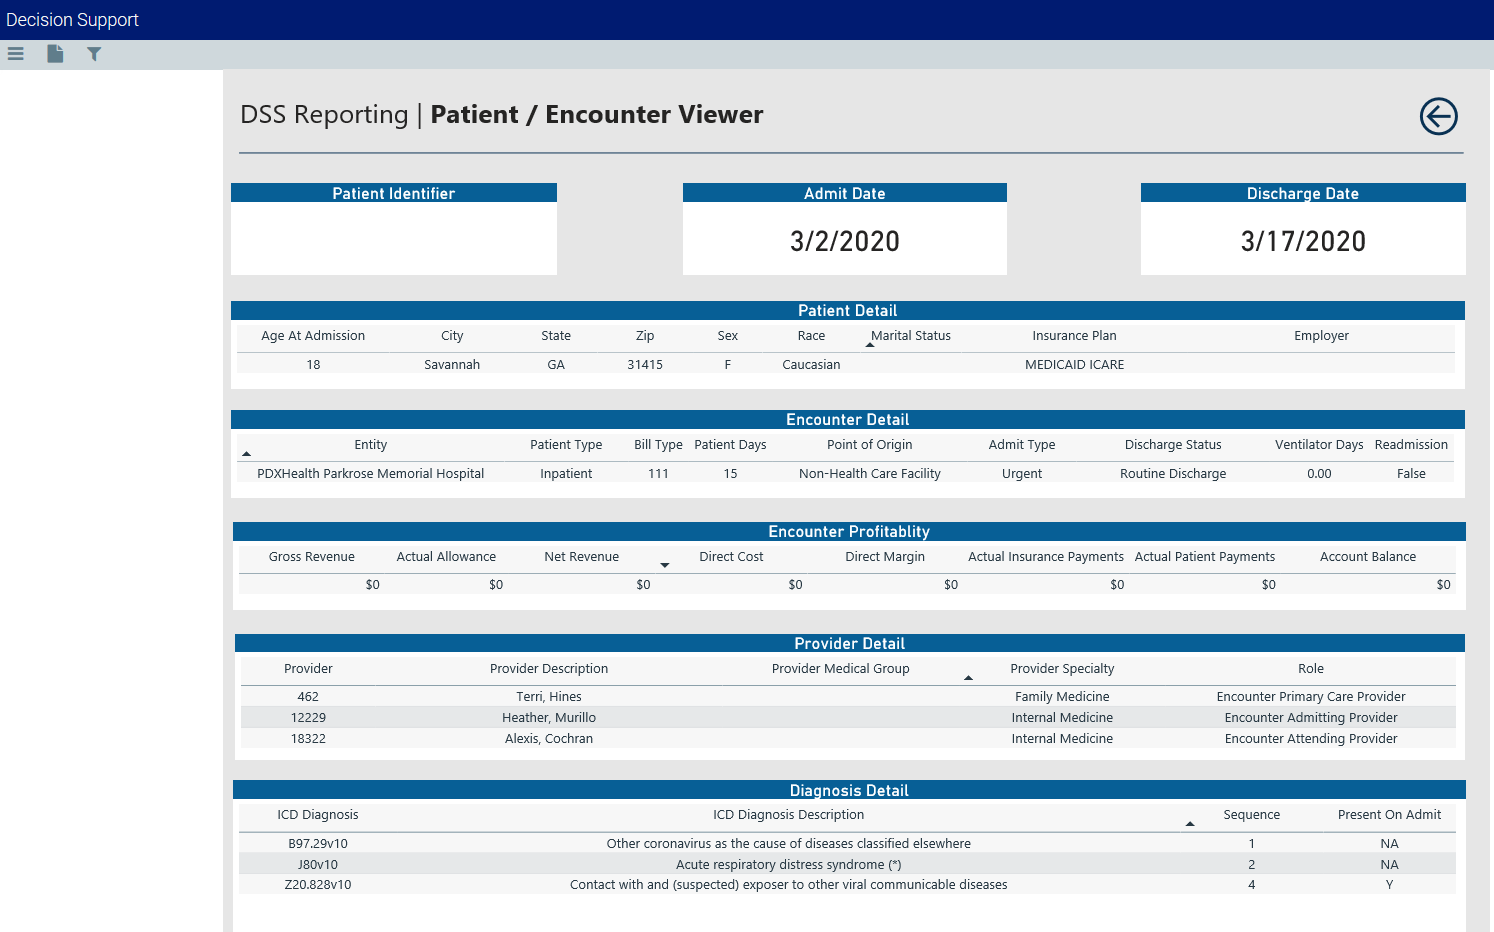
Patient/Encounter Viewer
When you drill through to a specific encounter from the Charge Detail table, the Patient/Encounter View page displays, which includes details regarding:
- Patient Identifier
- Admit Date
- Discharge Date
- Patient Detail
- Encounter Detail
- Encounter Profitability
- Provider Detail
- Diagnosis Detail
- Procedure Detail
- CPT Detail
- Charge Detail
In each table section, you can sort the information by columns in ascending or descending order by clicking the column header. To return to the COVID-19 Population Utilization report, click the arrow in the upper-right corner of the page.
Click image to view full size
Viewing data in table format
You can view the underlying data for visualization graphs and tables by right-clicking the image or table, and clicking Show as a table. A data table displays underneath the visualization graphic or table. To return to the dashboard, click Back to report in the upper left corner of the page.
Click image to view full size
